Terrain & Environment
Slope Map Generator
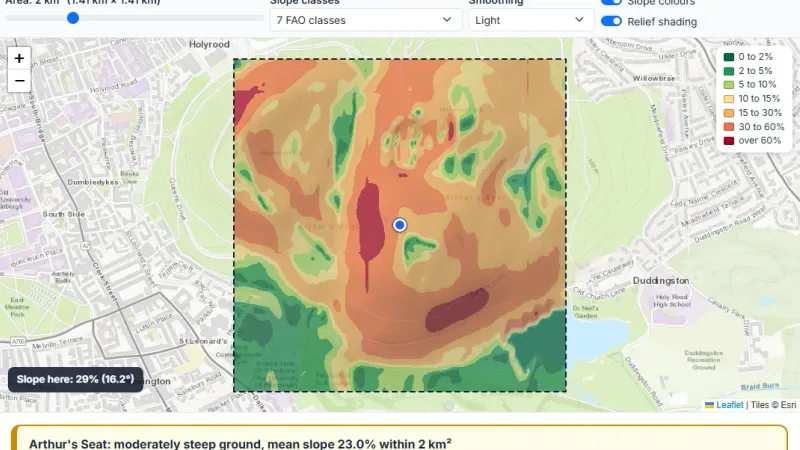
Click any place and see the land in a 1 to 5 km² square coloured by steepness, in 4 classes or the 7 FAO classes, with the share of each class, GeoTIFF, PNG and CSV downloads and a PDF report.

Click a place, set the water rise and see all the land in a 10 to 100 km area coloured red (flooded), orange, yellow or green (low risk), from the sea, rivers and lakes.
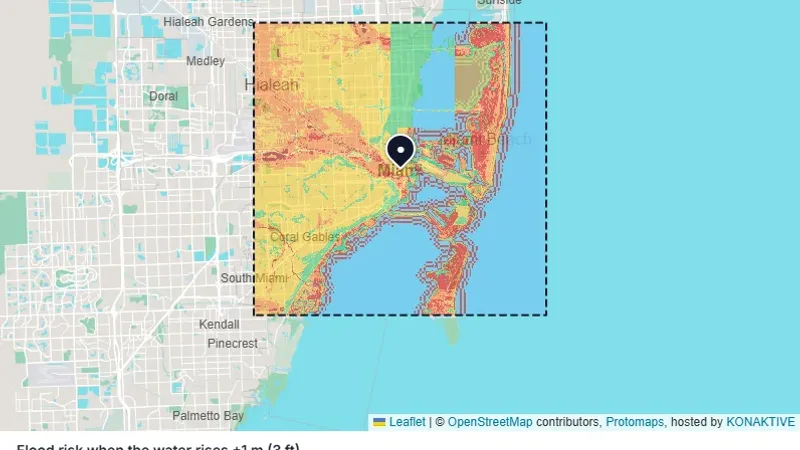
Click a place, set the water rise and see all the land in a 10 to 100 km area coloured red (flooded), orange, yellow or green (low risk), from the sea, rivers and lakes.
Try it live: Flood Risk Map on maplity.com
Click any place and see the land in a 1 to 5 km² square coloured by steepness, in 4 classes or the 7 FAO classes, with the share of each class, GeoTIFF, PNG and CSV downloads and a PDF report.
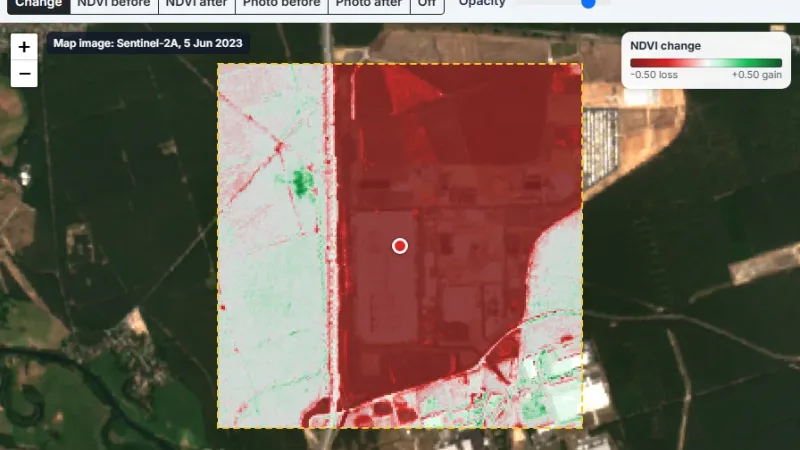
Click any place and get an NDVI map at 10 m from the clearest Sentinel-2 image of the month, or compare two dates to measure vegetation lost after a fire or a clearing.
Tell us about your data and your goals. We will reply with ideas, a plan and a cost estimate.